 Wading birds
The patient hunter
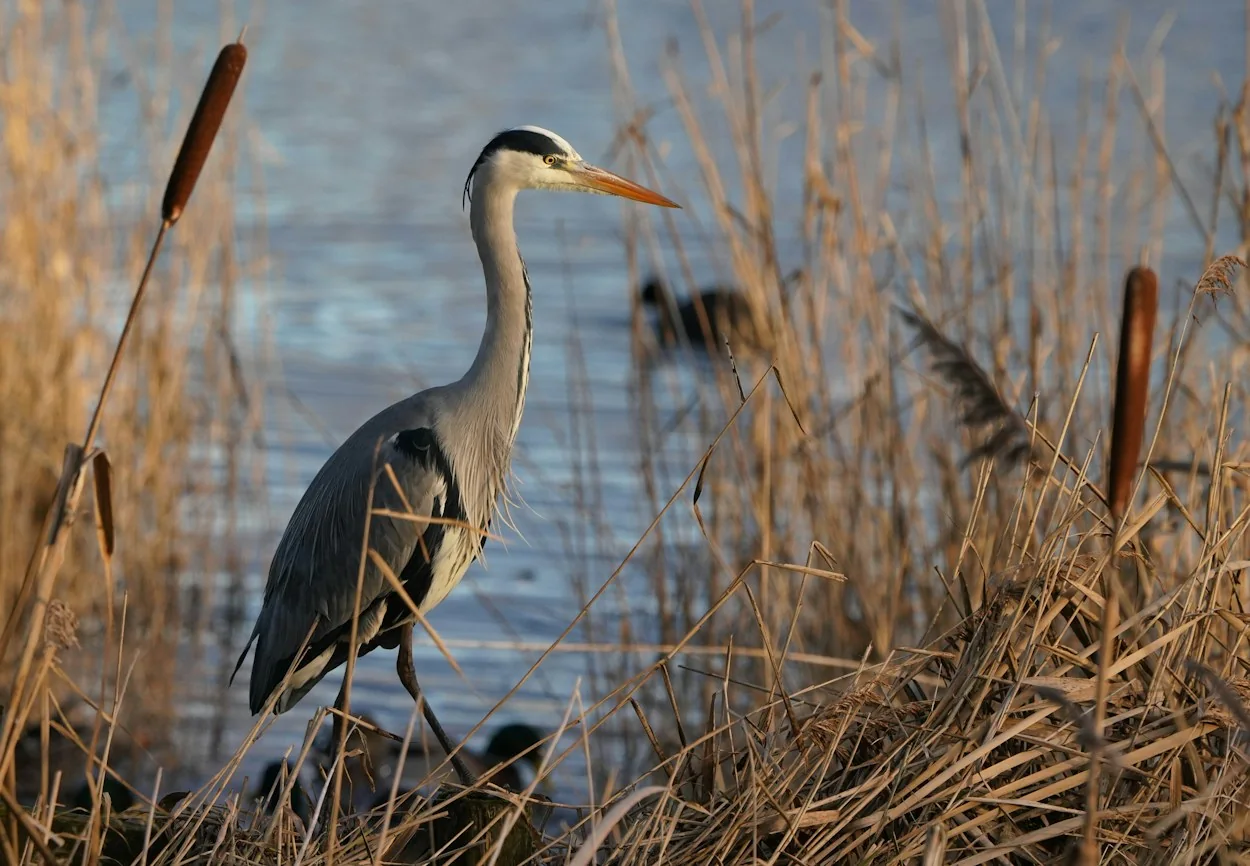
Great blue heron
Often seen standing remarkably still in shallow water, a great blue heron hunts fish, frogs and other small aquatic animals. Its long legs let it stalk wetland edges without swimming.
Celebrating the beauty, stories, and spirit of Duck Lake.
Association news, original photography and stories from around Duck Lake will appear here as authorized DLIA staff publish them.
When the President or Secretary publishes the first Journal entry, it will appear here automatically.
Bruce Corner's analysis is an important part of DLIA's research-led approach. His reported findings and source context deserve a beautiful, accessible presentation.
Sunlight on the water, familiar boats passing by, and Northern Michigan summers that make this community feel like home. Photographs from DLIA's supplied 2026 parade collections.
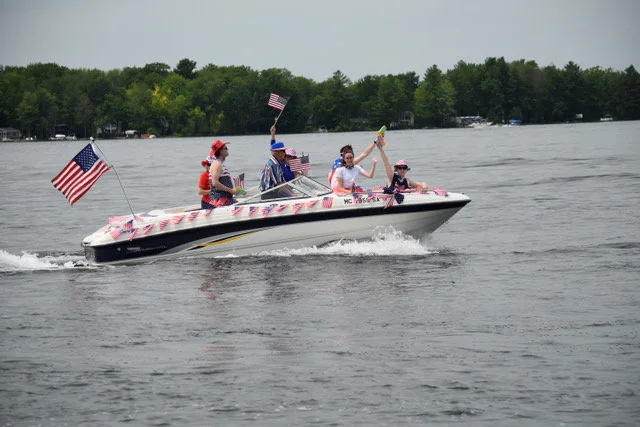
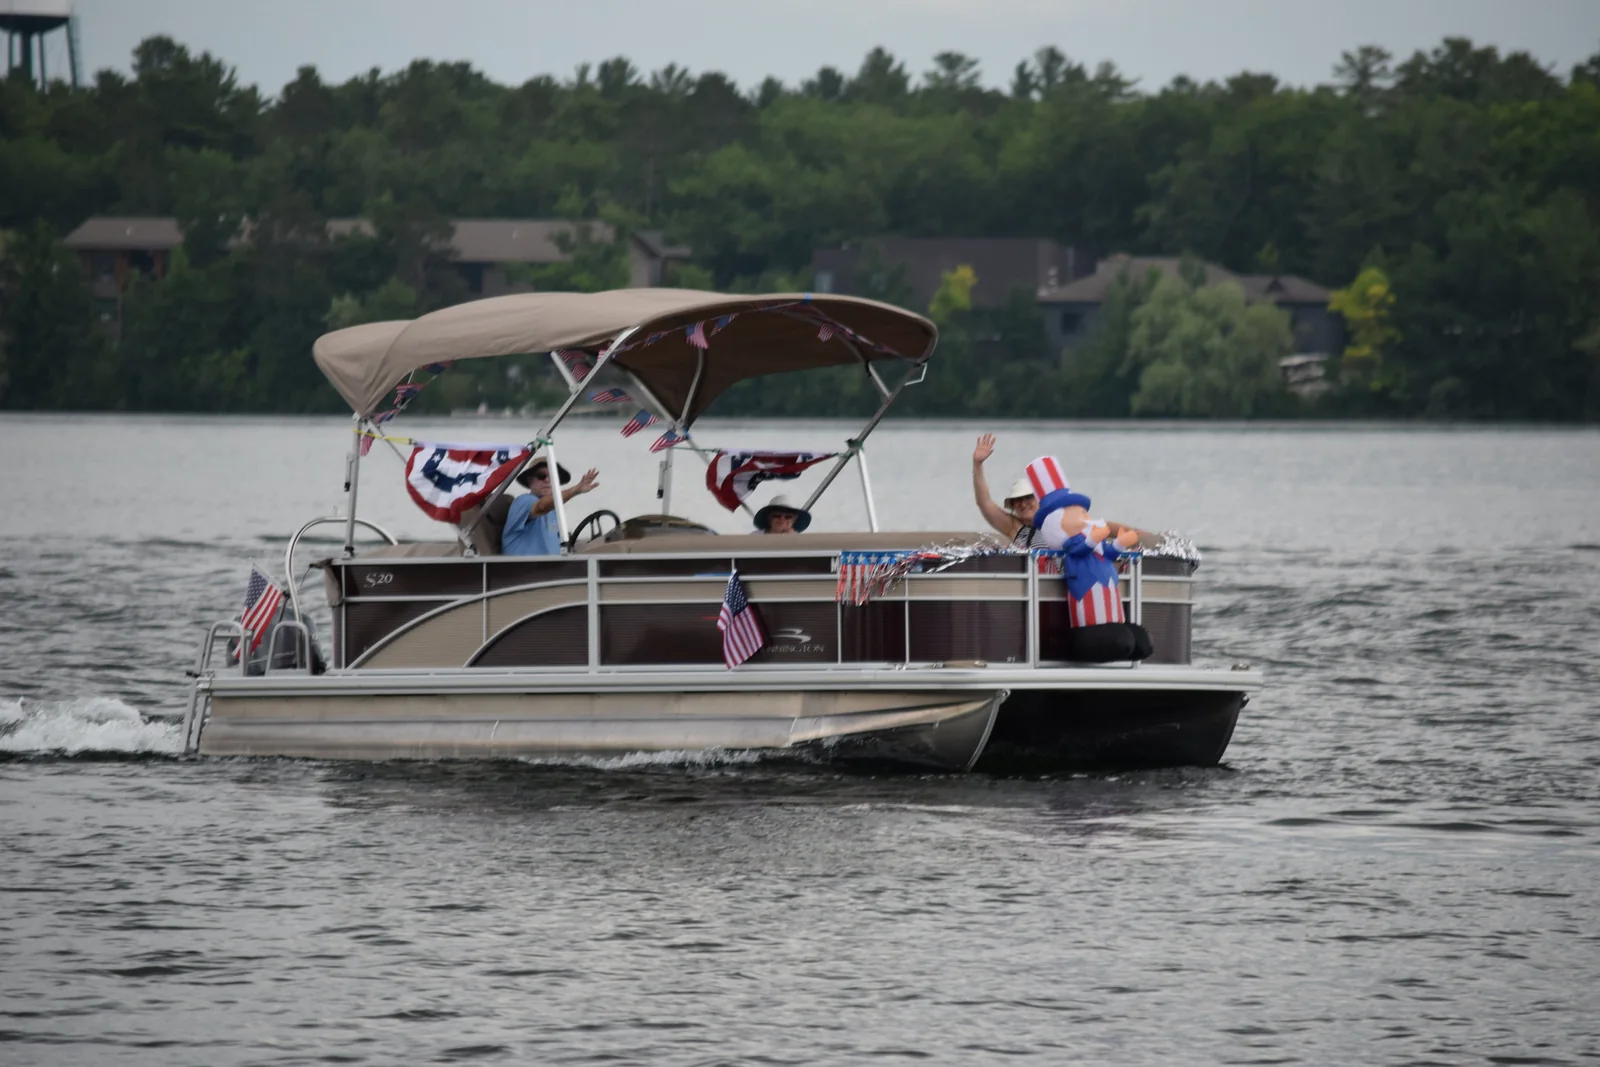
Original Duck Lake and Green Lake parade photographs, displayed in a symmetrical, easy-to-browse collection.
Why do Duck Lake and Green Lake so often rise and fall together? Bruce Corner analyzed 1,411 paired daily readings through Sept. 14, 2026 to look past the obvious pattern and ask what may be driving it.
Bruce’s analysis tells a clearer story when the results are read in sequence. Choose each finding below rather than taking in every statistic at once.
Across the paired daily readings, higher levels in one lake generally appear alongside higher levels in the other. That relationship is strong enough to deserve an explanation—but correlation alone does not identify the cause.
Bruce points toward influences that can affect both lakes while also recognizing that outlet and dam adjustments may have some effect. The study describes association and prediction; it does not claim to have identified one physical cause.
The Lake-Man feeds are the ongoing record. They are useful after the research gives the movement some context. View one graph at a time.
Use the weekly view to see the shape of the most recent movement. A short run of readings is more useful than judging one isolated point.
Bruce’s two source figures answer different questions. Switch between them and follow the visual cues before diving into the statistics.
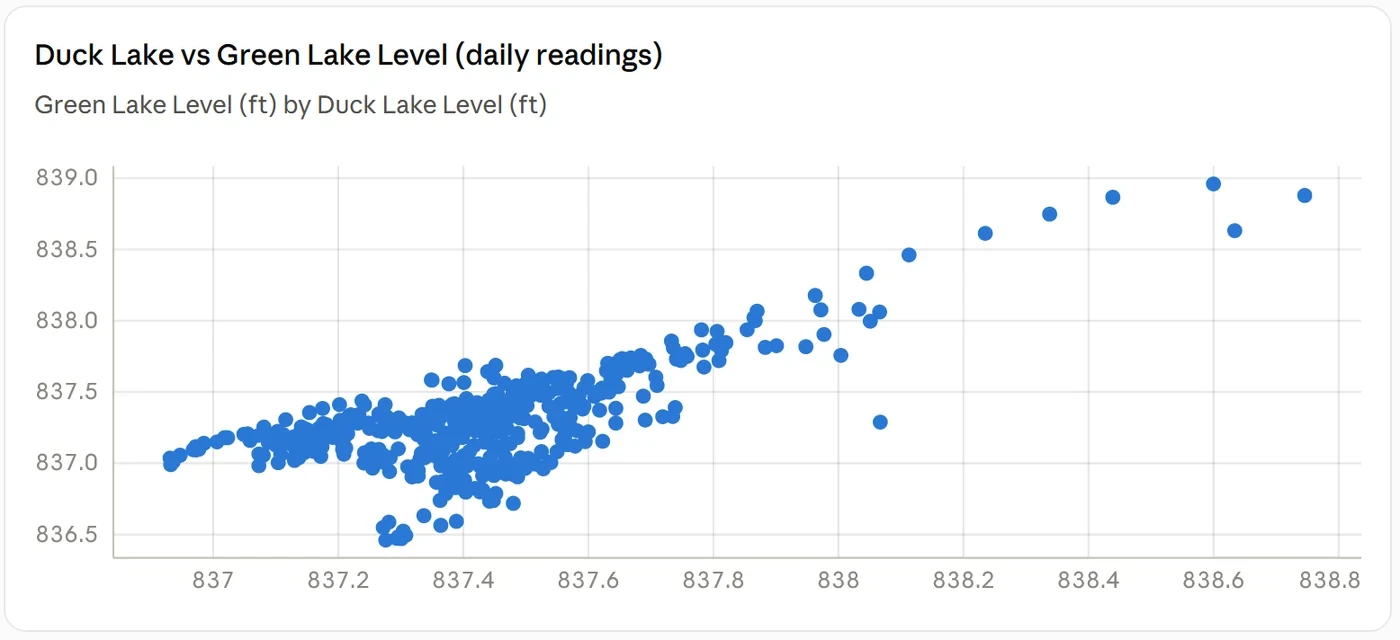
Duck Lake is on the horizontal axis; Green Lake is on the vertical axis. Each dot pairs the two measurements from the same day.
The cloud travels generally from lower left to upper right. High tends to pair with high, and low with low: a positive relationship.
Bruce argues that if raising Duck Lake were broadly depressing Green Lake, the visual expectation would be more negative—an upper-left to lower-right pattern as one rose while the other fell.
Strong positive Pearson correlation across the paired levels. Spearman ρ = 0.56 reminds us the relationship is not perfectly uniform across the entire range.
Bruce concludes that the evidence is more consistent with a common cause than with Duck Lake mechanically causing the measured changes in Green Lake. In his final paragraph, he says the twice-yearly dam changes make a small amount of physical influence plausible, while also stating that this limited effect is not statistically significant.
Bruce’s full analysis is still represented here, but divided into questions you can open one at a time. Click any row to read it.
Duck Lake and Green Lake are neighboring lakes in Green Lake Township, Grand Traverse County. Bruce’s report describes Duck Lake as the headwater of the Betsie River and notes that it flows toward Green Lake through a dam that partially controls Duck Lake levels.
The report explains that the Duck Lake Dam is adjusted seasonally: levels are lowered in fall and winter to help protect Duck Lake shorelines from ice erosion, then raised for spring and summer.
That management pattern helped frame the question Bruce wanted to test. Some had hypothesized that Duck Lake dam operations were detrimental to Green Lake levels. Because Green Lake also has other water sources, Bruce wrote that the relationship was not obvious from geography alone.
Bruce says he obtained the lake-level data from the Grand Traverse County Drain Commission and applied his professional background in statistical analysis to examine whether the measured pattern looked more like one lake mechanically driving the other—or both lakes responding to influences they share.
The report describes an ongoing study beginning November 7, 2022. The supplied analysis runs through September 14, 2026 and includes 1,411 paired daily observations recorded on matching dates.
Bruce reports 4 missing Duck Lake values and 8 missing Green Lake values.
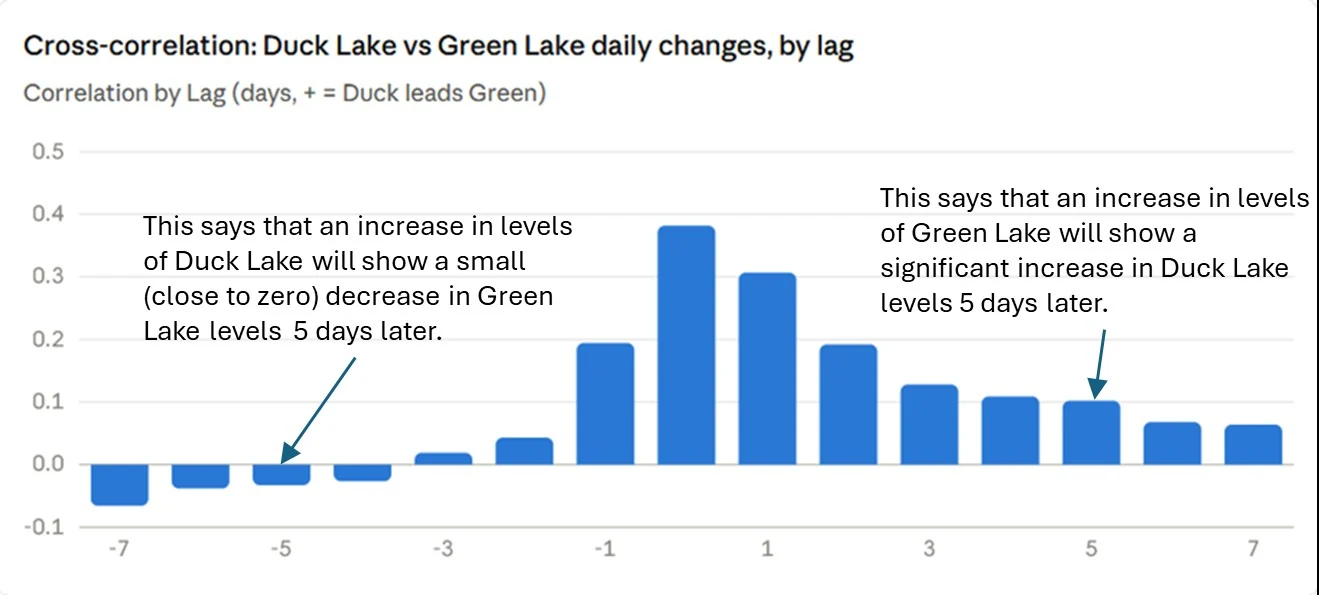
The analysis uses an XY scatter plot, Pearson correlation, Spearman rank correlation, correlation of day-to-day changes, Granger lead/lag testing, and cross-correlation of daily changes by lag.
Pearson r = 0.71 indicates a strong positive linear relationship between the measured levels. When Duck Lake is comparatively high, Green Lake also tends to be high; when one is low, both tend to be low.
Spearman ρ = 0.56 shows a moderate positive rank relationship. Bruce notes that it is lower than Pearson, suggesting the relationship is not perfectly monotonic throughout the range. His report points to a cluster of low Green Lake readings around roughly 836.8–837.0 ft where Duck Lake barely moves and is not increasing.
Correlation of day-to-day changes = 0.38. Once the focus shifts from raw levels to daily movement, the relationship weakens. Bruce interprets that difference as evidence that much of the stronger 0.71 raw-level relationship comes from the lakes trending together over longer periods—such as seasonal cycles—rather than reacting to each other tick-for-tick each day.
Bruce also used Granger causality testing. Despite the name, it asks whether earlier changes in one series improve prediction of later changes in the other; it does not by itself prove that one lake physically caused the other to move.
Duck → Green: the report says Duck Lake changes have statistically significant predictive power for Green Lake at a one-day lag, with p < 0.0001. Bruce also notes that some physical influence is intuitively plausible: changing dam level could produce at least a short-period response.
Green → Duck: this direction is also statistically significant and, in Bruce’s reported testing, shows larger F-statistics at every lag tested.
Bruce treats that two-way predictability as a key clue. If the dominant story were simply Duck Lake mechanically driving Green Lake, he argues that prediction would ordinarily be expected to run mainly in one direction. Instead, each lake helps predict the other, with Green showing the stronger statistical edge in the tested lags.
Bruce identifies possible shared influences including rainfall and snowmelt, a shared watershed or groundwater table, and coordinated water-management releases.
The cross-correlation analysis adds another clue. Bruce reports that the daily-change relationship peaks at lag 0, r = 0.38, then decays fairly symmetrically as the comparison moves backward and forward in time. He notes that this does not show the sharp “one lake leads by X days” signature one might expect from a simple direct water-transfer explanation.
The analysis does not claim the dam has no effect. In the report's final paragraph, Bruce says the twice-yearly dam changes make a small amount of physical causation plausible, but he also writes that this limited effect is not statistically significant.
Important source nuance: earlier in the report, the Duck → Green Granger predictability result is reported as statistically significant at a one-day lag (p < 0.0001). Bruce separately warns that Granger testing is statistical predictability, not proof of true physical causation. This page keeps those statements separate rather than treating the predictive result as proof that dam operations physically caused Green Lake changes.
The study supports an interpretation of the measured data; it does not establish a single physical mechanism.
The Research page is organized for readability, but Bruce Corner's original four-page PDF remains available so readers can see his wording, figures, methodology and conclusions directly.
Original figure from Bruce Corner’s supplied analysis, reproduced with attribution.
Thank you for considering a contribution to the Duck Lake Improvement Association. Our team is preparing a secure online donation experience, and this page will become available once the official giving link has been finalized.
In the meantime, we'd be happy to answer any questions about supporting DLIA.